Analytics X3: Text Analysis R, Python, and Julia
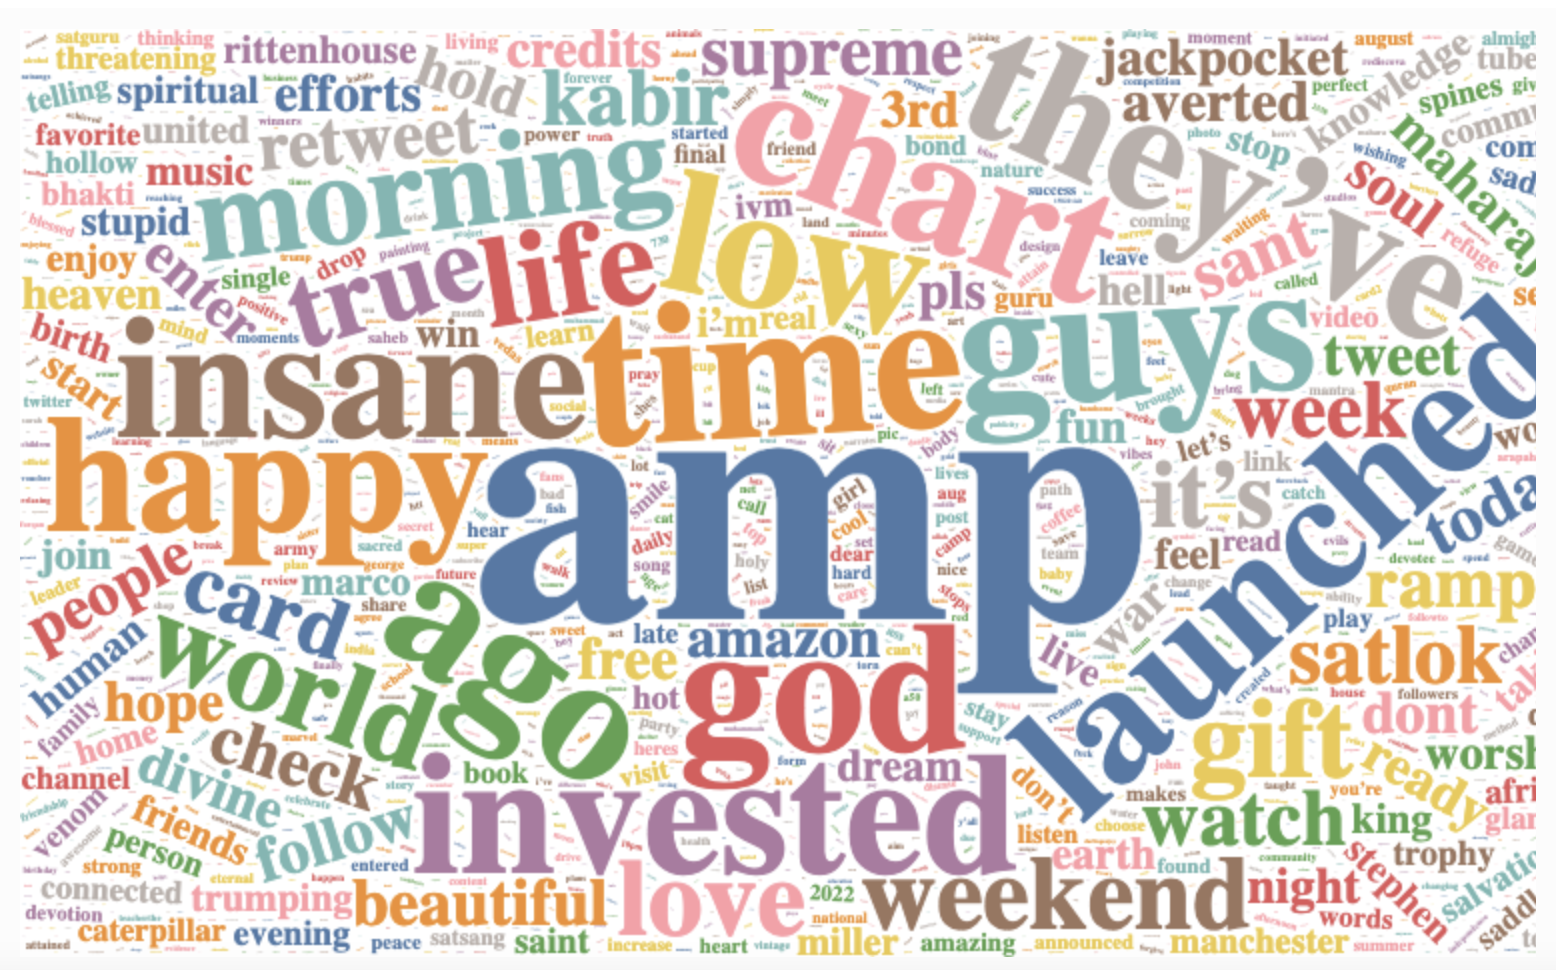
Creating a wordcloud with data scraped from Twitter, and publishing in Quarto!
Creating a wordcloud with data scraped from Twitter, and publishing in Quarto!
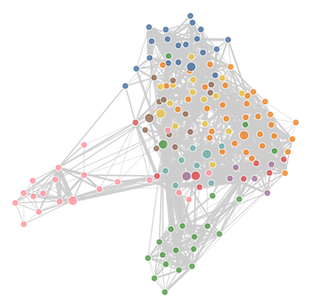
What I learned about network analysis at rstudio::conf(2022).
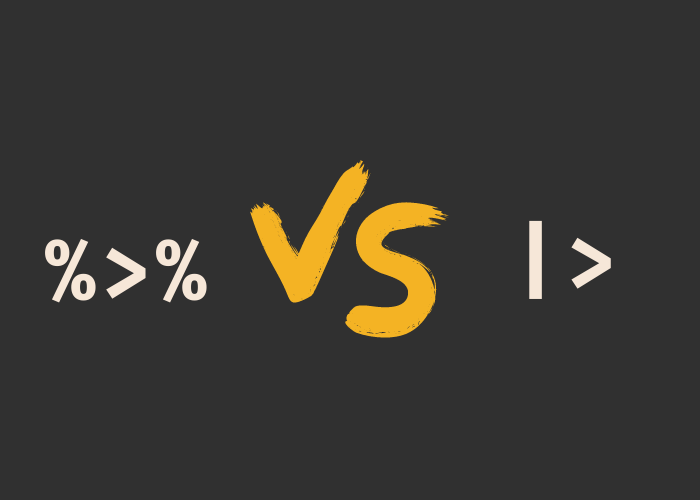
What I learned so far by testing all my old code, plus an example of ligature font features.
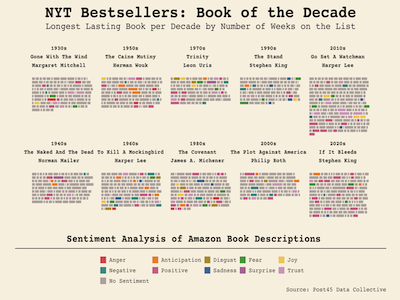
Creating interactive plots of longest-active authors and most popular book per decade in ggplot2 and ggplotly.
Recreating a Tableau Dashboard in R, Python, and Julia code, plus interactive plots with plotly.