Tidy Tuesday: Olympic Medals
By Katie Press in TidyTuesday
July 26, 2021
Background
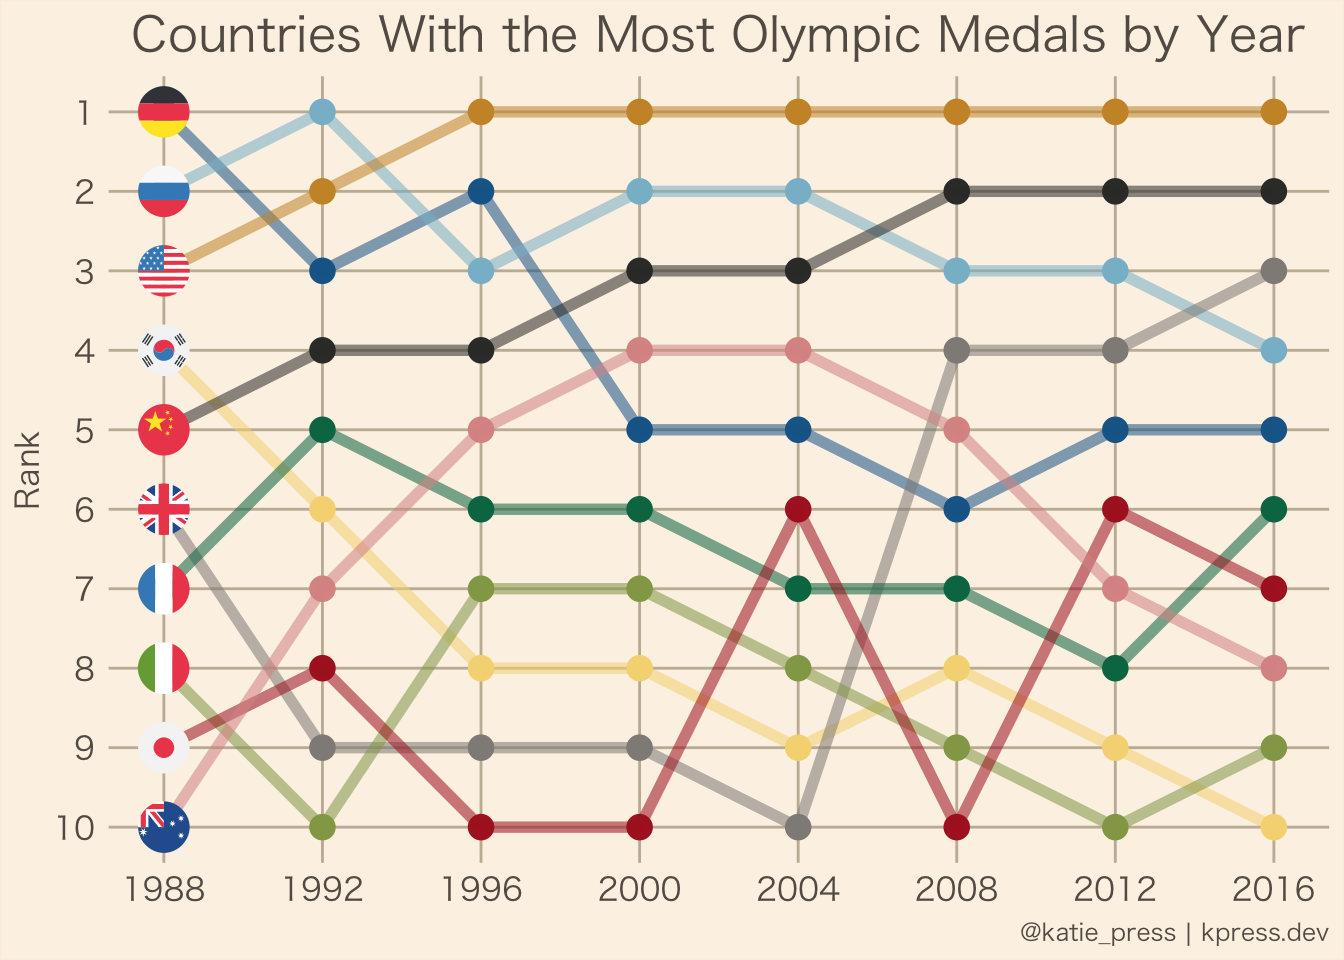
This week’s Tidy Tuesday data is from the Olympic games over time. I thought it would be interesting to create a chart of the countries with the most medals at each Olympic games to see how things changed over time.
Data Import and Cleaning
knitr::opts_chunk$set(echo = TRUE,message=FALSE,warning=FALSE)
library(tidyverse)
library(lubridate)
library(janitor)
library(ggplot2)
library(gganimate)
library(ggflags)
library(countrycode)
library(reactable)
#devtools::install_github("rensa/ggflags")
Get the provided data from the tidytuesdayR package first. I was expecting one file but there were two, so now I have a list of dataframes which I can unlist into my global environment. I’m not sure if I’ll need the second dataset (regions), but I will go ahead and add them to the olympics dataset just in case.
data <- tidytuesdayR::tt_load('2021-07-27')
##
##  Downloading file 1 of 2: `olympics.csv`
##  Downloading file 2 of 2: `regions.csv`
list2env(data, .GlobalEnv)
## <environment: R_GlobalEnv>
regions <- regions %>%
  clean_names()

olympics <- olympics %>%
  left_join(regions)
Count the Olympic medals by country by year. I’m counting one medal per event otherwise they would be over-counted due to the team events since every person on the team gets a medal. I need to use season and not just year when I’m aggregating, because some of the older events had summer and winter Olympics in the same year. Also adding the total medals per region/year.
year_df <- olympics %>%
  count(year, region, season, event, medal) %>%
  count(year, region, season, medal) %>%
  filter(!is.na(medal)) %>%
  rename("medal_n" = n)

year_df <- year_df %>%
  group_by(year, season, region) %>%
  mutate(medal_total = sum(medal_n)) %>%
  ungroup()
Add the number of athletes by country by year. Using extra demographic variables in case any athletes have the same name.
year_df <- olympics %>%
  count(year, season, region, sex, age, name) %>%
  count(year, season, region) %>%
  rename("athlete_total" = n) %>%
  right_join(year_df)
Now I have to decide which counties to include in the chart since there are so many. Let’s look at the average number of medals over the last 10 Olympic games. This will be separate for summer and winter because the number and type of events is different for the winter games. I’m just going to save these country names in a vector called “summer.top.10”.
year_df %>%
  filter(season == "Summer", year > 1979) %>%
  distinct(year, region, medal_total) %>%
  group_by(region) %>%
  summarise(avg_medals = round(mean(medal_total), 2)) %>%
  arrange(desc(avg_medals)) %>%
  react_table()
And here are the top countries for the winter games, which I will save in a winter.top.10 vector.
year_df %>%
  filter(season == "Winter", year > 1979) %>%
  distinct(year, region, medal_total) %>%
  group_by(region) %>%
  summarise(avg_medals = round(mean(medal_total), 2)) %>%
  arrange(desc(avg_medals)) %>%
  react_table()
Now filter to get the medals per year for the top 10 countries (by season as well). I can use seq_along to order them 1 through 10 after grouping by year. However, there is going to be a problem because in some years, multiple regions have the same number of medals. For example, in 1988, Italy, Japan, and Australia each have 14 medals.
summer_medals <- year_df %>%
  filter(season == "Summer", year > 1979, region %in% summer.top.10) %>%
  distinct(year, region, medal_total) %>%
  arrange(year, desc(medal_total)) %>%
  group_by(year) %>%
  mutate(rank = seq_along(medal_total))

summer_medals %>%
  get_dupes(year, medal_total) %>%
  react_table()
I could rank them with a random tie-breaker, but I think I’m going to try something else. I’ll make a new column for the previous rank, and then order by year, medal number, and previous rank. That way if the number of medals is tied, it will rely on the previous year’s ranking to break the tie. This will also mean that more regions can stay the same from one year to another instead of bouncing all around due to a random tie breaker, which I think will make the chart much easier to read.
summer_medals <- summer_medals %>%
  arrange(region, year) %>%
  group_by(region) %>%
  mutate(prev_rank = lag(rank)) %>%
  #get_dupes(year, medal_total) %>%
  arrange(year, desc(medal_total), prev_rank) %>%
  group_by(year) %>%
  mutate(final_rank = seq_along(region)) %>%
  ungroup()

summer_medals %>%
  filter(year != 1980) %>%
  react_table()
temp_levels <- summer_medals %>%
  filter(year == 1988) %>%
  mutate(region = factor(region)) %>%
  mutate(region = fct_reorder(region, final_rank))

summer_medals <- summer_medals %>%
  mutate(region = factor(region, levels = temp_levels$region))

summer_medals$team_country <- countrycode(summer_medals$region, "country.name", "iso2c")

summer_medals <- summer_medals %>% mutate(team_country = str_to_lower(team_country))
For the plot I decided to start at 1988, because that is the first year that all 10 countries were in the games. This way the chart will be consistent from beginning to end. What I’m doing here is making sure that I have the theme and look of the plot the way I want it before I animate it. Notes on this:
- For the geom_point I had to add the grouping aesthetic because if I didn’t, the lines would show up in the animation and the points would not, although the geom_flag worked fine. I tried a bunch of different things and finally got this to work so hopefully it saves someone else the aggravation.
- I used alpha in geom_line to make it slightly more transparent, this is just a stylistic choice and could be deleted for a solid color line.
- In the geom_flag I commented out the filter that I use on the final animated plot so that all the dots are not covered by flags and I can make sure the dots look the way I want them to. I decided to use solid color and no alpha for the points.
- The color scheme was inspired by this cover image from Sports Illustrated
summer_medals %>%
  filter(year >= 1988) %>%
  ggplot(., aes(x = year, y = final_rank, color = region)) +
  geom_point(aes(group = seq_along(final_rank), color = region), size = 4) +
  geom_line(aes(color = region, alpha=1), size = 2) +
  scale_x_continuous(breaks = seq(1980, 2016, 4))+
  scale_y_reverse(breaks = seq(1, 10, 1))+
  scale_color_manual(values = olympic.pal2)+
  geom_flag(data = summer_medals %>%
              #filter(year >1984),
              filter(year == 1988),
            aes(country = team_country),
            size = 8) +
  ggtitle("Countries With the Most Olympic Medals by Year")+
    ylab("Rank")+
  labs(caption = "@katie_press | kpress.dev")+
  theme_minimal()+
  my_theme
Now for the final plot all I’m doing is adding transition_reveal using the year as the reveal, and saving as an object.
final.plot <- summer_medals %>%
  filter(year >= 1988) %>%
  ggplot(., aes(x = year, y = final_rank, color = region)) +
  geom_point(aes(group = seq_along(final_rank), color = region), size = 4) +
  geom_line(aes(color = region, alpha=1), size = 2) +
  scale_x_continuous(breaks = seq(1980, 2016, 4))+
  scale_y_reverse(breaks = seq(1, 10, 1))+
  scale_color_manual(values = olympic.pal2)+
  geom_flag(data = summer_medals %>% filter(year >1984),
            aes(country = team_country),
            size = 8) +
  ggtitle("Countries With the Most Olympic Medals by Year")+
    ylab("Rank")+
  labs(caption = "@katie_press | kpress.dev")+
  theme_minimal()+
  my_theme +
  transition_reveal(year)
Finally I can save the animation as a gif to share. I’m using end_pause here so that my gif pauses for a few seconds once it gets to the end of the animation.
final.animated <- animate(final.plot, renderer = gifski_renderer("olympics.gif"), width = 8, height = 5, units = "in", res = 300, dev= "png", end_pause = 10)
